KPI Studio
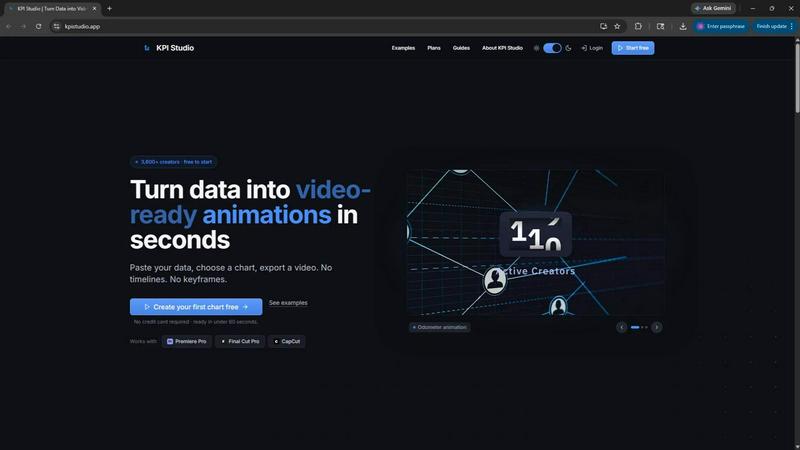
KPI Studio transforms raw data into polished, animated video charts in under 60 seconds without timelines or keyframes.
About KPI Studio
KPI Studio is a specialized software tool built for data-driven video creators who need to incorporate animated charts and metrics into their content but lack the time or expertise for complex motion design. The platform addresses a fundamental workflow problem: traditional methods for creating data visualizations for video are either amateurish, time-consuming, or prohibitively expensive. Screenshots of static charts look unprofessional, Canva templates lack the flexibility required for precise data representation, Adobe After Effects demands hours of keyframe and timeline manipulation, and hiring freelance motion designers introduces delays and recurring costs. KPI Studio eliminates this entire process by providing a streamlined, three-step workflow: paste your data, choose a chart style, and export a fully animated, video-ready visual in under 60 seconds. There are no timelines to manage, no keyframes to set, and no complex setup procedures. The tool is designed for creators who operate on a publish schedule and need reliable, fast results. Exports support transparent backgrounds, allowing charts to be dropped directly into professional editing software like Premiere Pro, Final Cut Pro, and CapCut without any additional editing. For advanced users, JSON export capabilities enable deeper customization and integration into custom production pipelines. With over 3,600 creators already using the platform, KPI Studio positions itself as the fast path to professional data visualization in video content.
Features of KPI Studio
Rapid Data-to-Video Workflow
The core feature of KPI Studio is its ability to transform raw data into a finished animated video export in under 60 seconds. Users simply paste their numerical data into the interface, select a chart type from the available templates, and click export. The entire process requires no timeline manipulation, keyframe animation, or any form of manual setup. This speed is critical for creators on tight deadlines who need to iterate quickly or respond to last-minute data changes without redoing hours of work.
Multi-Format Video Export
KPI Studio offers extensive export flexibility to integrate seamlessly with any video production workflow. Users can export their animated charts in multiple formats including MP4, MOV with transparency, GIF, and PNG sequences. The transparent background option is particularly valuable, allowing charts to be placed directly over existing video footage or graphics in editing software without requiring chroma keying or masking. Supported aspect ratios include 16:9 widescreen, 1:1 square, 9:16 vertical stories, and 4:3 standard formats.
Diverse Animated Chart Types
The platform provides a range of pre-built animated chart types designed for different data storytelling needs. Count-up numbers animate milestone metrics like subscriber counts or revenue totals. Growing bar charts reveal comparisons between competitors, time periods, or product lines as bars rise on screen. Drawing line charts show revenue trends or audience growth over time as a self-drawing line animation. These chart types are optimized for video consumption and require no customization beyond pasting the data.
Advanced JSON Export for Custom Pipelines
For creators with more complex workflow requirements, KPI Studio offers JSON export capabilities. This feature allows users to export their chart data and animation parameters in a structured, machine-readable format. The JSON output can be imported into other applications, custom scripts, or advanced editing pipelines for further manipulation. This bridges the gap between the tool's rapid output and the need for deep customization in professional post-production environments.
Use Cases of KPI Studio
YouTube Data-Driven Content
YouTube creators who produce analytical or review content can use KPI Studio to quickly generate animated charts that visualize subscriber growth, revenue trends, or comparative performance metrics. Instead of spending hours in After Effects to animate a simple bar chart comparing monthly earnings, creators can paste their data, select a chart style, and export a transparent-background video that drops directly into their Premiere Pro timeline. This allows for more frequent data updates and faster video production cycles.
Social Media Short-Form Video
Social media managers and content creators producing short-form videos for platforms like Instagram, TikTok, and YouTube Shorts can leverage KPI Studio to create engaging animated metrics. Vertical 9:16 aspect ratio exports with count-up animations are perfect for revealing milestone achievements, growth statistics, or industry benchmarks in a visually compelling way. The transparent background feature ensures these animations can be overlaid on existing footage or branded backgrounds without complex compositing.
Corporate and Business Presentations
Professionals who need to incorporate animated data visualizations into PowerPoint or Google Slides presentations can use KPI Studio to create polished, motion-based charts. Rather than relying on static screenshots or basic slide animations, users can export animated bar charts or line graphs that automatically play during presentations. This adds a layer of professionalism and audience engagement that static visuals cannot achieve, making quarterly reports, investor updates, and sales presentations more impactful.
eLearning and Educational Video
Educators and instructional designers creating video-based learning materials can use KPI Studio to animate statistical data, historical trends, or comparative information. Animated charts help maintain viewer attention and improve information retention, as motion-based content has been shown to outperform static visuals. The tool's simplicity allows educators to update data quickly for different courses or academic periods without needing graphic design skills or external motion design resources.
Frequently Asked Questions
What file formats can I export from KPI Studio?
KPI Studio supports multiple export formats to accommodate different editing workflows and platforms. You can export your animated charts as MP4 video files, MOV files with an alpha channel for transparent backgrounds, GIF animations for web use, and PNG sequences for frame-by-frame editing. Each format is available in various aspect ratios including 16:9, 1:1, 9:16, and 4:3. The transparent background options in MOV and GIF formats are particularly useful for directly overlaying charts onto existing video footage in editing software like Premiere Pro, Final Cut Pro, and CapCut.
How long does it take to create an animated chart?
KPI Studio is designed to transform your data into a finished animated video export in under 60 seconds. The process involves three simple steps: paste your data, choose your chart type, and click export. There are no timelines to set up, no keyframes to animate, and no complex configuration required. This rapid turnaround is essential for creators working on tight publishing schedules who need to produce multiple charts per video or make last-minute data changes without significant time investment.
Is KPI Studio suitable for beginners with no animation experience?
Yes, KPI Studio is built specifically for users who do not have motion design experience or access to professional animation tools. The interface is straightforward and requires no knowledge of keyframes, timelines, or animation principles. Users simply paste their numerical data into the provided fields, select a chart template from the available options, and export the finished video. The tool handles all animation automatically, making it accessible to content creators, educators, business professionals, and social media managers who need professional-looking data visualizations without technical expertise.
Can I update my data after exporting a chart?
Yes, updating your data is simple with KPI Studio. Since the tool does not use a project file system that requires re-linking assets or adjusting keyframes, you can simply paste your new data, select the same chart type and settings, and export a new video file. This process takes less than 60 seconds, making it easy to refresh charts for recurring reports, updated statistics, or new video episodes. There is no need to reopen complex motion design projects or wait for freelance designers to make changes.
Pricing of KPI Studio
KPI Studio offers three pricing tiers to accommodate different usage levels and budget requirements. The Free plan is available at no cost and includes unlimited PNG exports, three free animated exports, access to all chart types, and real-time preview functionality. No credit card is required to start. The Creator Pack is a one-time purchase for $11.99 and includes everything in the Free plan plus ten video exports in GIF, MP4, WebM, and MOV formats, no watermark on exports, 1080p resolution, and no expiry on credits. The Pro plan is the most popular option at $19.99 per month and includes everything in the Free plan plus unlimited video exports in all formats, no watermark, 4K resolution exports, and the ability to cancel anytime.
Similar to KPI Studio
Ribbi
Ribbi is a self-evolving creative AI agent that automates and replicates your social media content to grow your account.
ChatGPT Image 2
ChatGPT Image 2 is an all-in-one AI workspace for generating, editing, and transforming images and videos with professional-grade quality.